Using Serilog for logging in Asp.Net Core Minimal APIs
With Debug, File and ElasticSearch sinks.

I am an enthusiastic software developer focusing on C#, .NET, Asp.NET, Azure and Angular.
In the previous blog post, we talked about logging and we used a logging provider from Microsoft. In this blog post, we will use Serilog.
Serilog
Like many other libraries for .NET, Serilog provides diagnostic logging to files, the console, and elsewhere. It can be used in classic .NET Framework applications, in Xamarin.Forms applications and applications running on the latest and greatest .NET 6.
Sinks
Sinks are the way how and where the logs can be sent. Structured log events are written to sinks; each sink is responsible for writing it to its backend, database, store, etc. Serilog has a vast range of sinks that can be used. Each one of them is a nugget package that can be installed in the application. In this blog post, we will use three of them.
Debug
A Serilog sink that writes log events to the debug output window. For more details access the GitHub repository.
File
A Serilog sink that writes events to one or more text files. With this sink is possible to define the following settings, for more details access the GitHub repository.
formatter: log as JSONpath: the log file pathfileSizeLimitBytes: default: 1 GB, usenullfor unlimitedrollingInterval: Specifies the frequency at which the log file should roll. default: “Day”rollOnFileSizeLimit: a new file will be created when the file size limit is reached default:trueretainedFileCountLimit: The maximum number of log files that will be retained including the current log file. default: 31 days.shared: to enable multi-process shared log files, default:false
Elasticsearch
The Serilog Elasticsearch sink project is a writer for the Serilog logging framework. This sink delivers the data to Elasticsearch, a NoSQL search engine. It has a lot of settings, for more details access the GitHub repository.
Implementation
To use the sinks it is necessary to install the correct nugget package. The configuration for the logger can be done by code, XML <appSettings> configuration or JSON appsettings.json configuration.
For XML <appSettings> configuration is necessary to install the package Serilog.Settings.AppSettings.
For JSON appsettings.json configuration is necessary to install the package Serilog.Settings.Configuration.
Another package that is recommended to install is Serilog.AspNetCore. This package routes ASP.NET Core log messages through Serilog, so we can get information about ASP.NET's internal operations written to the same Serilog sinks as our application events.
Debug
To use the Debug sink, install the package Serilog.Sinks.Debug. After that, the output template can be configured if needed.
builder.Logging.ClearProviders();
builder.Host.UseSerilog((hostContext, services, configuration) => {
    configuration
    .WriteTo.Debug(outputTemplate: "[{Timestamp:HH:mm:ss} {Level:u3}] {Message:lj}{NewLine}{Exception}");
});
The ILogger interface can be injected into the endpoints.
app.MapGet("/", (ILogger logger) =>
{
    logger.Information("Logging information.");
    logger.Error("Logging critical information.");
    logger.Debug("Logging debug information.");
    logger.Error("Logging error information.");
    logger.Warning("Logging warning.");

    return "Hello World!";
});
This is an example of the output after running the app and calling the endpoint.
[10:48:35 INF] Now listening on: https://localhost:7063
[10:48:35 INF] Now listening on: http://localhost:5063
[10:48:35 INF] Application started. Press Ctrl+C to shut down.
[10:48:35 INF] Hosting environment: Development
[10:48:36 INF] Request starting HTTP/2 GET https://localhost:7063/_framework/aspnetcore-browser-refresh.js - -
[10:48:36 INF] Request starting HTTP/2 GET https://localhost:7063/_vs/browserLink - -
[10:48:37 INF] Request finished HTTP/2 GET https://localhost:7063/swagger/index.html - - - 200 - text/html;charset=utf-8 657.4176ms
[10:48:37 INF] Request finished HTTP/2 GET https://localhost:7063/_framework/aspnetcore-browser-refresh.js - - - 200 12006 application/javascript;+charset=utf-8 17.0781ms
'ApiFluentValidator.exe' (CoreCLR: clrhost): Loaded 'C:\Program Files\dotnet\shared\Microsoft.NETCore.App\6.0.11\System.Net.WebSockets.dll'. Skipped loading symbols. Module is optimized and the debugger option 'Just My Code' is enabled.
[10:48:37 INF] Request finished HTTP/2 GET https://localhost:7063/_vs/browserLink - - - 200 - text/javascript;+charset=UTF-8 47.4439ms
[10:48:37 INF] Request finished HTTP/2 GET https://localhost:7063/swagger/v1/swagger.json - - - 200 - application/json;charset=utf-8 243.7456ms
[10:48:49 INF] BasicAuthentication was not authenticated. Failure message: Header Not Found.
[10:48:49 INF] Executing endpoint 'HTTP: GET /'
[10:48:49 INF] Logging information.
[10:48:49 ERR] Logging critical information.
[10:48:49 ERR] Logging error information.
[10:48:49 WRN] Logging warning.
[10:48:49 INF] Executed endpoint 'HTTP: GET /'
[10:48:49 INF] Request finished HTTP/2 GET https://localhost:7063/ - - - 200 - text/plain;+charset=utf-8 223.9726ms
Instead of writing the configuration by code, we can use the appsettings file to define the configuration.
  "Serilog": {
    "WriteTo": [
      {
        "Name": "Debug",
        "Args": {
          "outputTemplate": "[{Timestamp:HH:mm:ss} {Level:u3}] {Message:lj} <s:{SourceContext}>{NewLine}{Exception}"
        }
      }
    ]
  }
We also need to change the way to configure the Logger, it is necessary to inform the app that the configuration needs to be read.
builder.Host.UseSerilog((context, services, configuration) => configuration
    .ReadFrom.Configuration(context.Configuration));
File
The steps to use this sink is pretty much the same as Debug. First, it is necessary to install the nugget package Serilog.Sinks.File after that is necessary to define the settings for the logger. A file will be created and will contain the app's log.
builder.Logging.ClearProviders();
builder.Host.UseSerilog((hostContext, services, configuration) => {
    configuration
    .WriteTo.File(
      "diagnostics.txt",
       rollingInterval: RollingInterval.Day,
       fileSizeLimitBytes: 10 * 1024 * 1024,
       retainedFileCountLimit: 2,
       rollOnFileSizeLimit: true,
       shared: true,
       flushToDiskInterval: TimeSpan.FromSeconds(1));
});
The same configuration can be done through the appsettings file. To load the configuration is the same code that was used for Debug.
  "Serilog": {
    "MinimumLevel": "Information",
    "WriteTo": [
      {
        "Name": "File",
        "Args": {
          "path": "diagnostics.txt",
          "outputTemplate": "[{Timestamp:HH:mm:ss} {SourceContext} [{Level}] {Message}{NewLine}{Exception}",
          "rollingInterval": "Day",
          "fileSizeLimitBytes": 4194304,
          "retainedFileCountLimit": 2,
          "rollOnFileSizeLimit": true,
          "shared": true
        }
      }
    ]
  }
Elasticsearch
First, we need to configure the environment to have ElasticSearch and Kibana running. I will not get into details about it because I think it deserves a blog post exclusive to it. You can access this link to know how to configure ElasticSearch and Kibana with Docker.
To use the sink, it is necessary to install the nugget package Serilog.Sinks.Elasticsearch and then define the configuration for this sink.
builder.Logging.ClearProviders();
builder.Host.UseSerilog((hostContext, services, configuration) =>
{
    configuration
    .WriteTo.Elasticsearch(new ElasticsearchSinkOptions(new Uri("http://localhost:9200"))
    {
        FailureCallback = e => Console.WriteLine("Unable to submit event " + e.MessageTemplate),
        EmitEventFailure = EmitEventFailureHandling.WriteToSelfLog | EmitEventFailureHandling.WriteToFailureSink | EmitEventFailureHandling.RaiseCallback,
        QueueSizeLimit = 100000,
        BatchPostingLimit = 50,
        IndexFormat = "custom-index-{0:yyyy.MM}"
    });
});
The configuration can be defined in the appsettings too.
{
  "Serilog": {
    "WriteTo": [{
        "Name": "Elasticsearch",
        "Args": {
          "nodeUris": "http://localhost:9200;",
          "indexFormat": "custom-index-{0:yyyy.MM}",
          "templateName": "myCustomTemplate",
          "typeName": "myCustomLogEventType",
          "pipelineName": "myCustomPipelineName",
          "batchPostingLimit": 50,
          "batchAction": "Create",
          "period": 2,
          "inlineFields": true,
          "restrictedToMinimumLevel": "Warning",
          "bufferFileSizeLimitBytes": 5242880,
          "bufferLogShippingInterval": 5000,
          "bufferRetainedInvalidPayloadsLimitBytes": 5000,
          "bufferFileCountLimit": 31,
          "connectionTimeout": 5,
          "emitEventFailure": "WriteToSelfLog",
          "queueSizeLimit": "100000",
          "autoRegisterTemplate": true,
          "overwriteTemplate": false,
          "registerTemplateFailure": "IndexAnyway",
          "numberOfShards": 20,
          "numberOfReplicas": 10
        }
    }]
  }
}
The ElasticSearch sink configuration has two important parameters, the ElasticSearch URL and the “IndexFormat”.
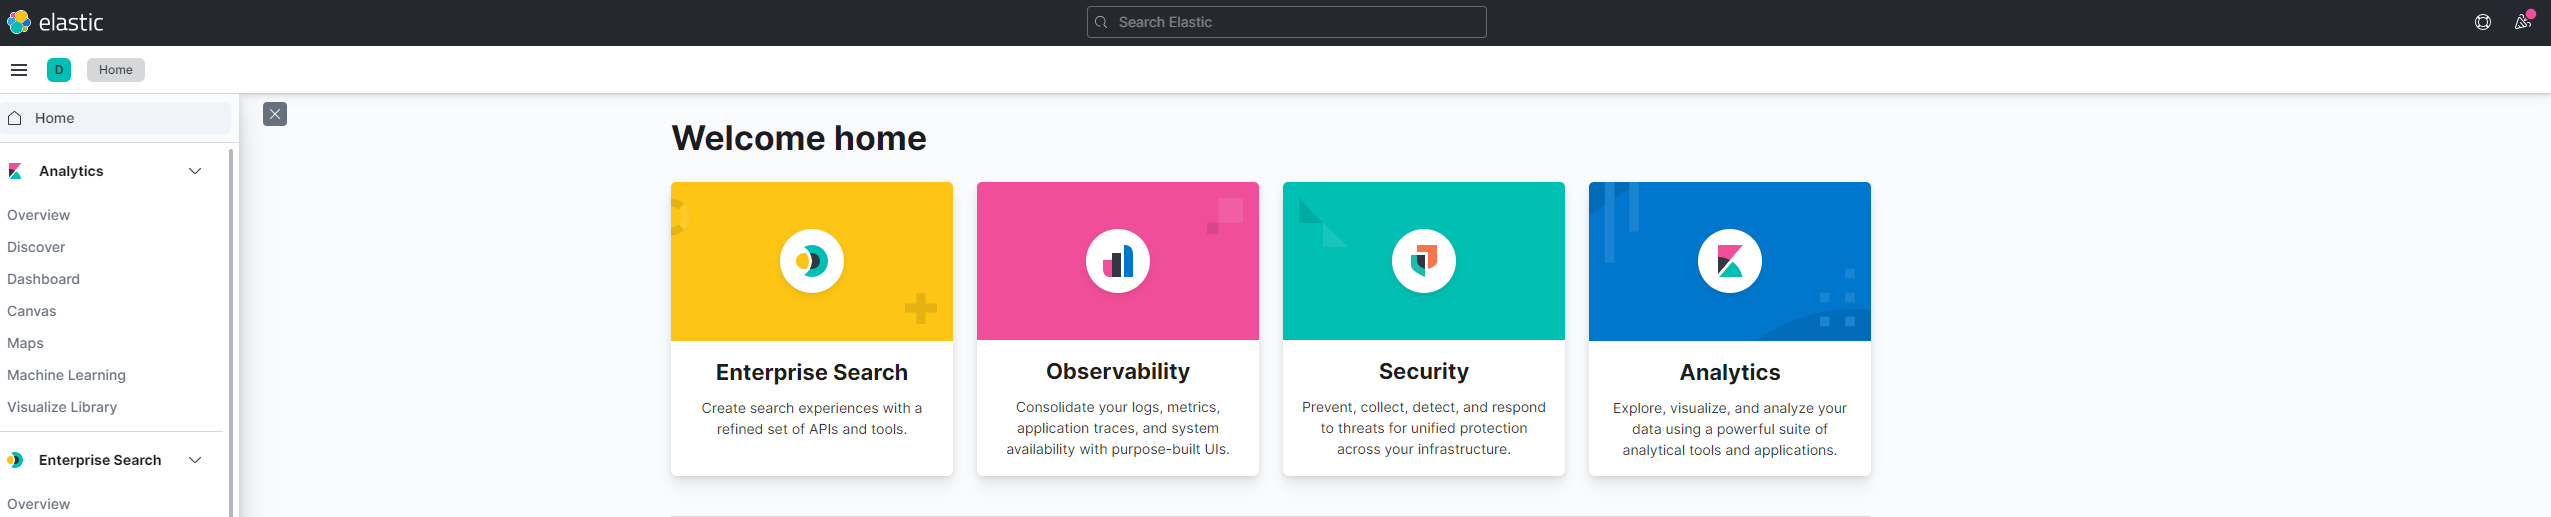
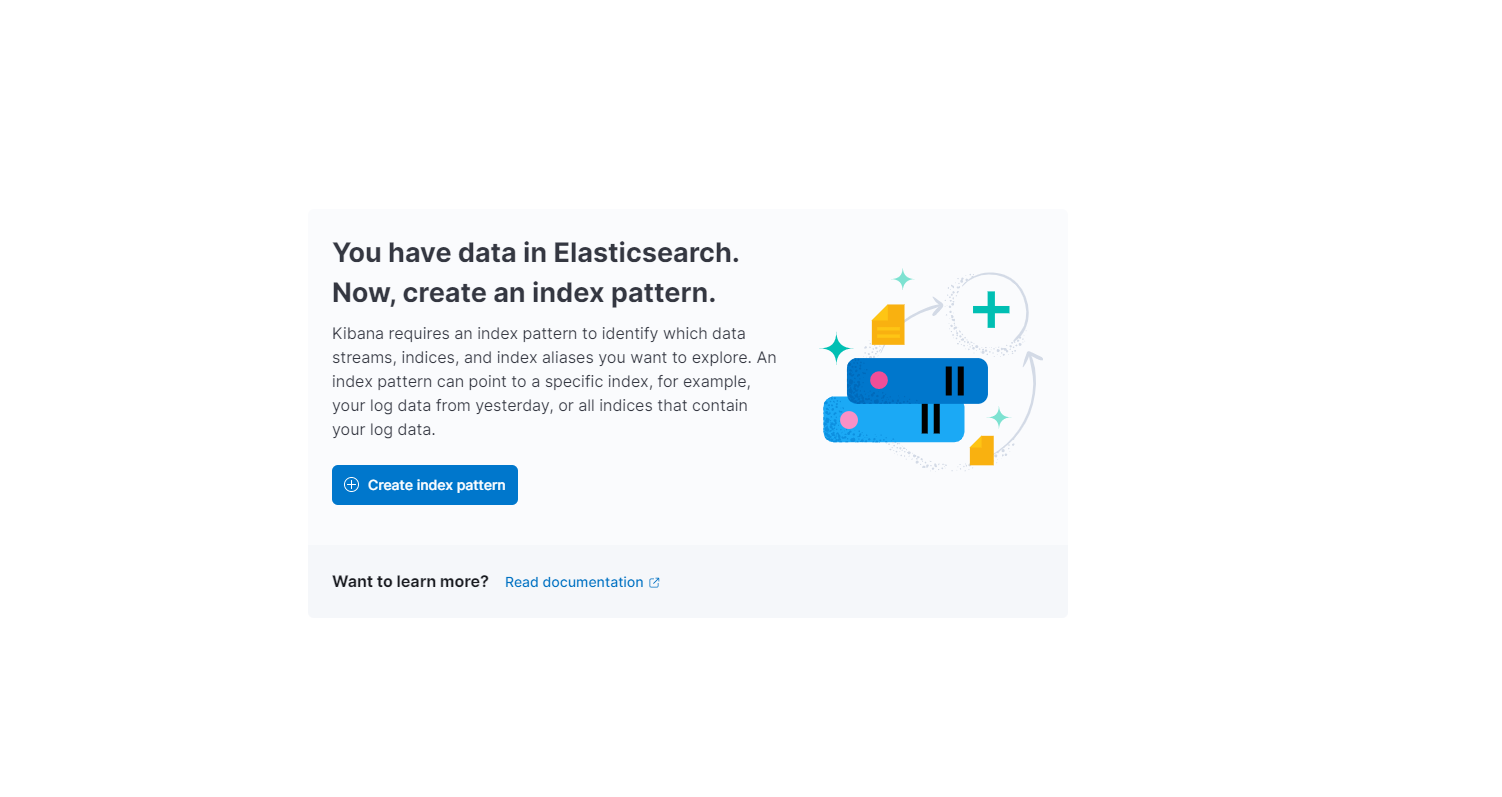
Kibana won’t show anything unless we create an index, so to do it, we need to access http://localhost:5601, go to Discover and then Create Index Pattern.
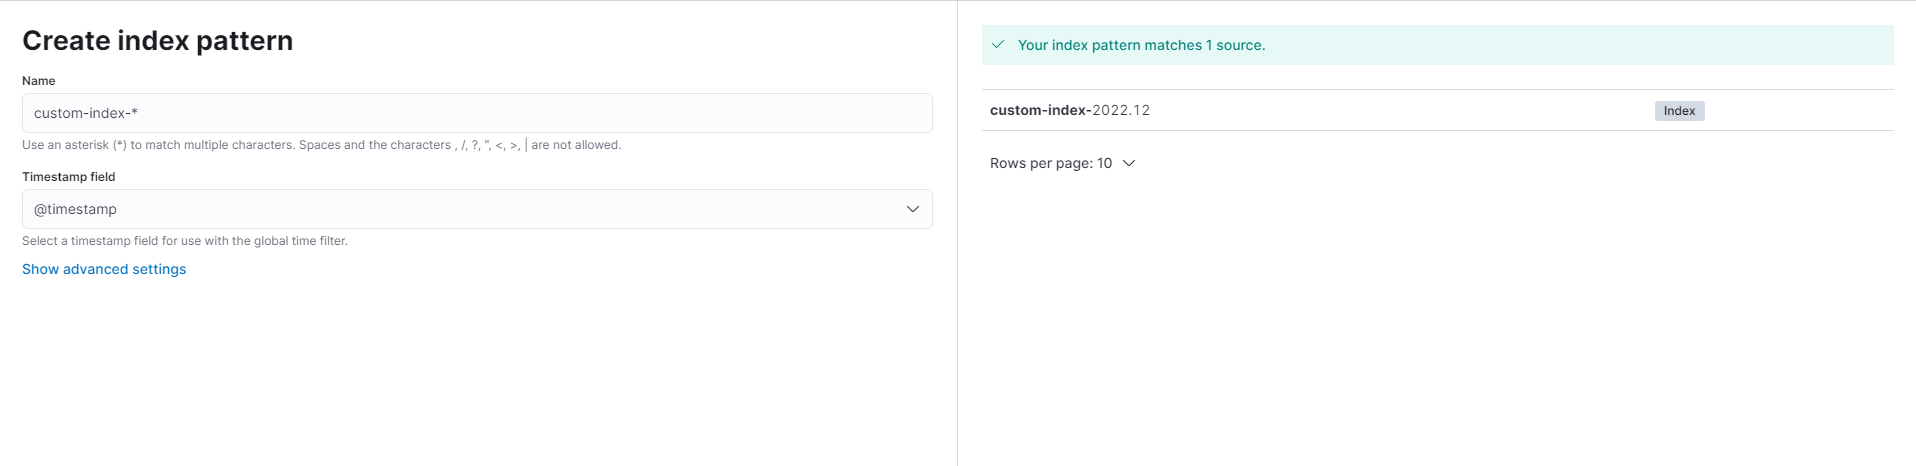
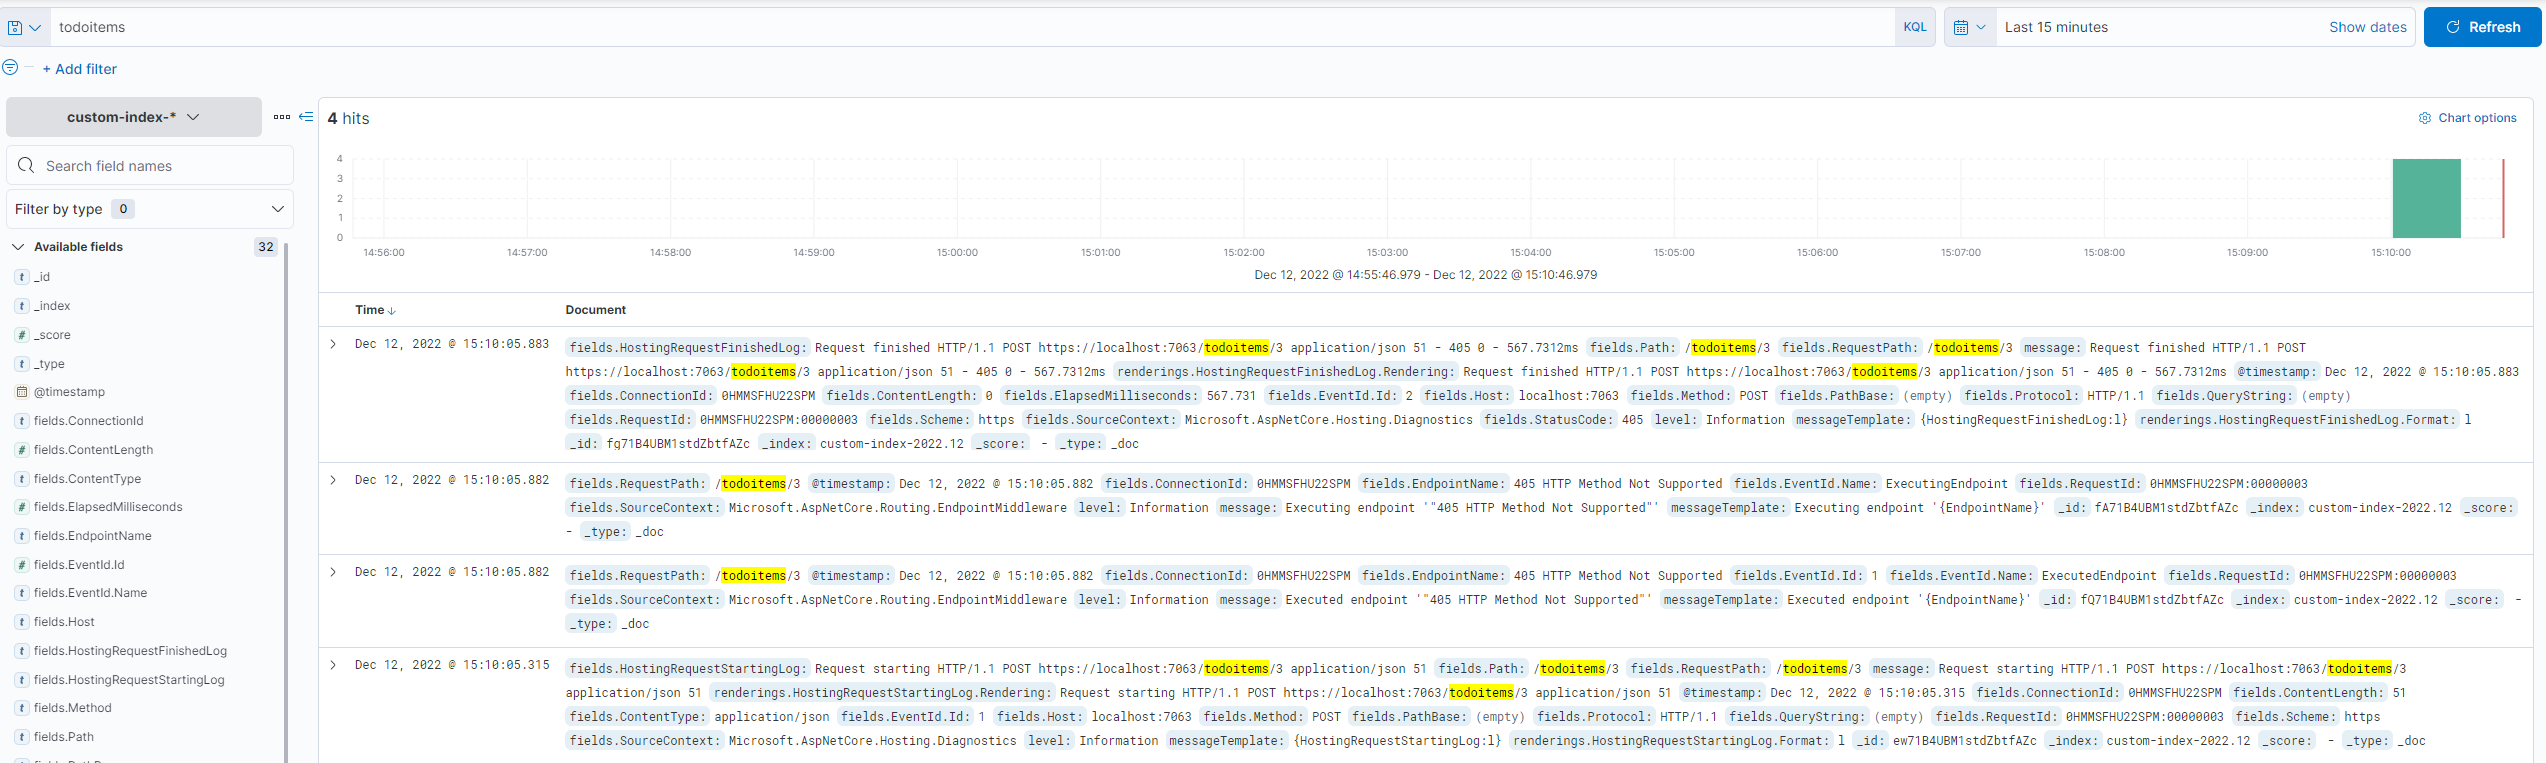
The pattern that was defined in the property IndexFormat will be used to create a new index. We will use the following pattern: custom-index-*, this will match all the indexes generated by the app.
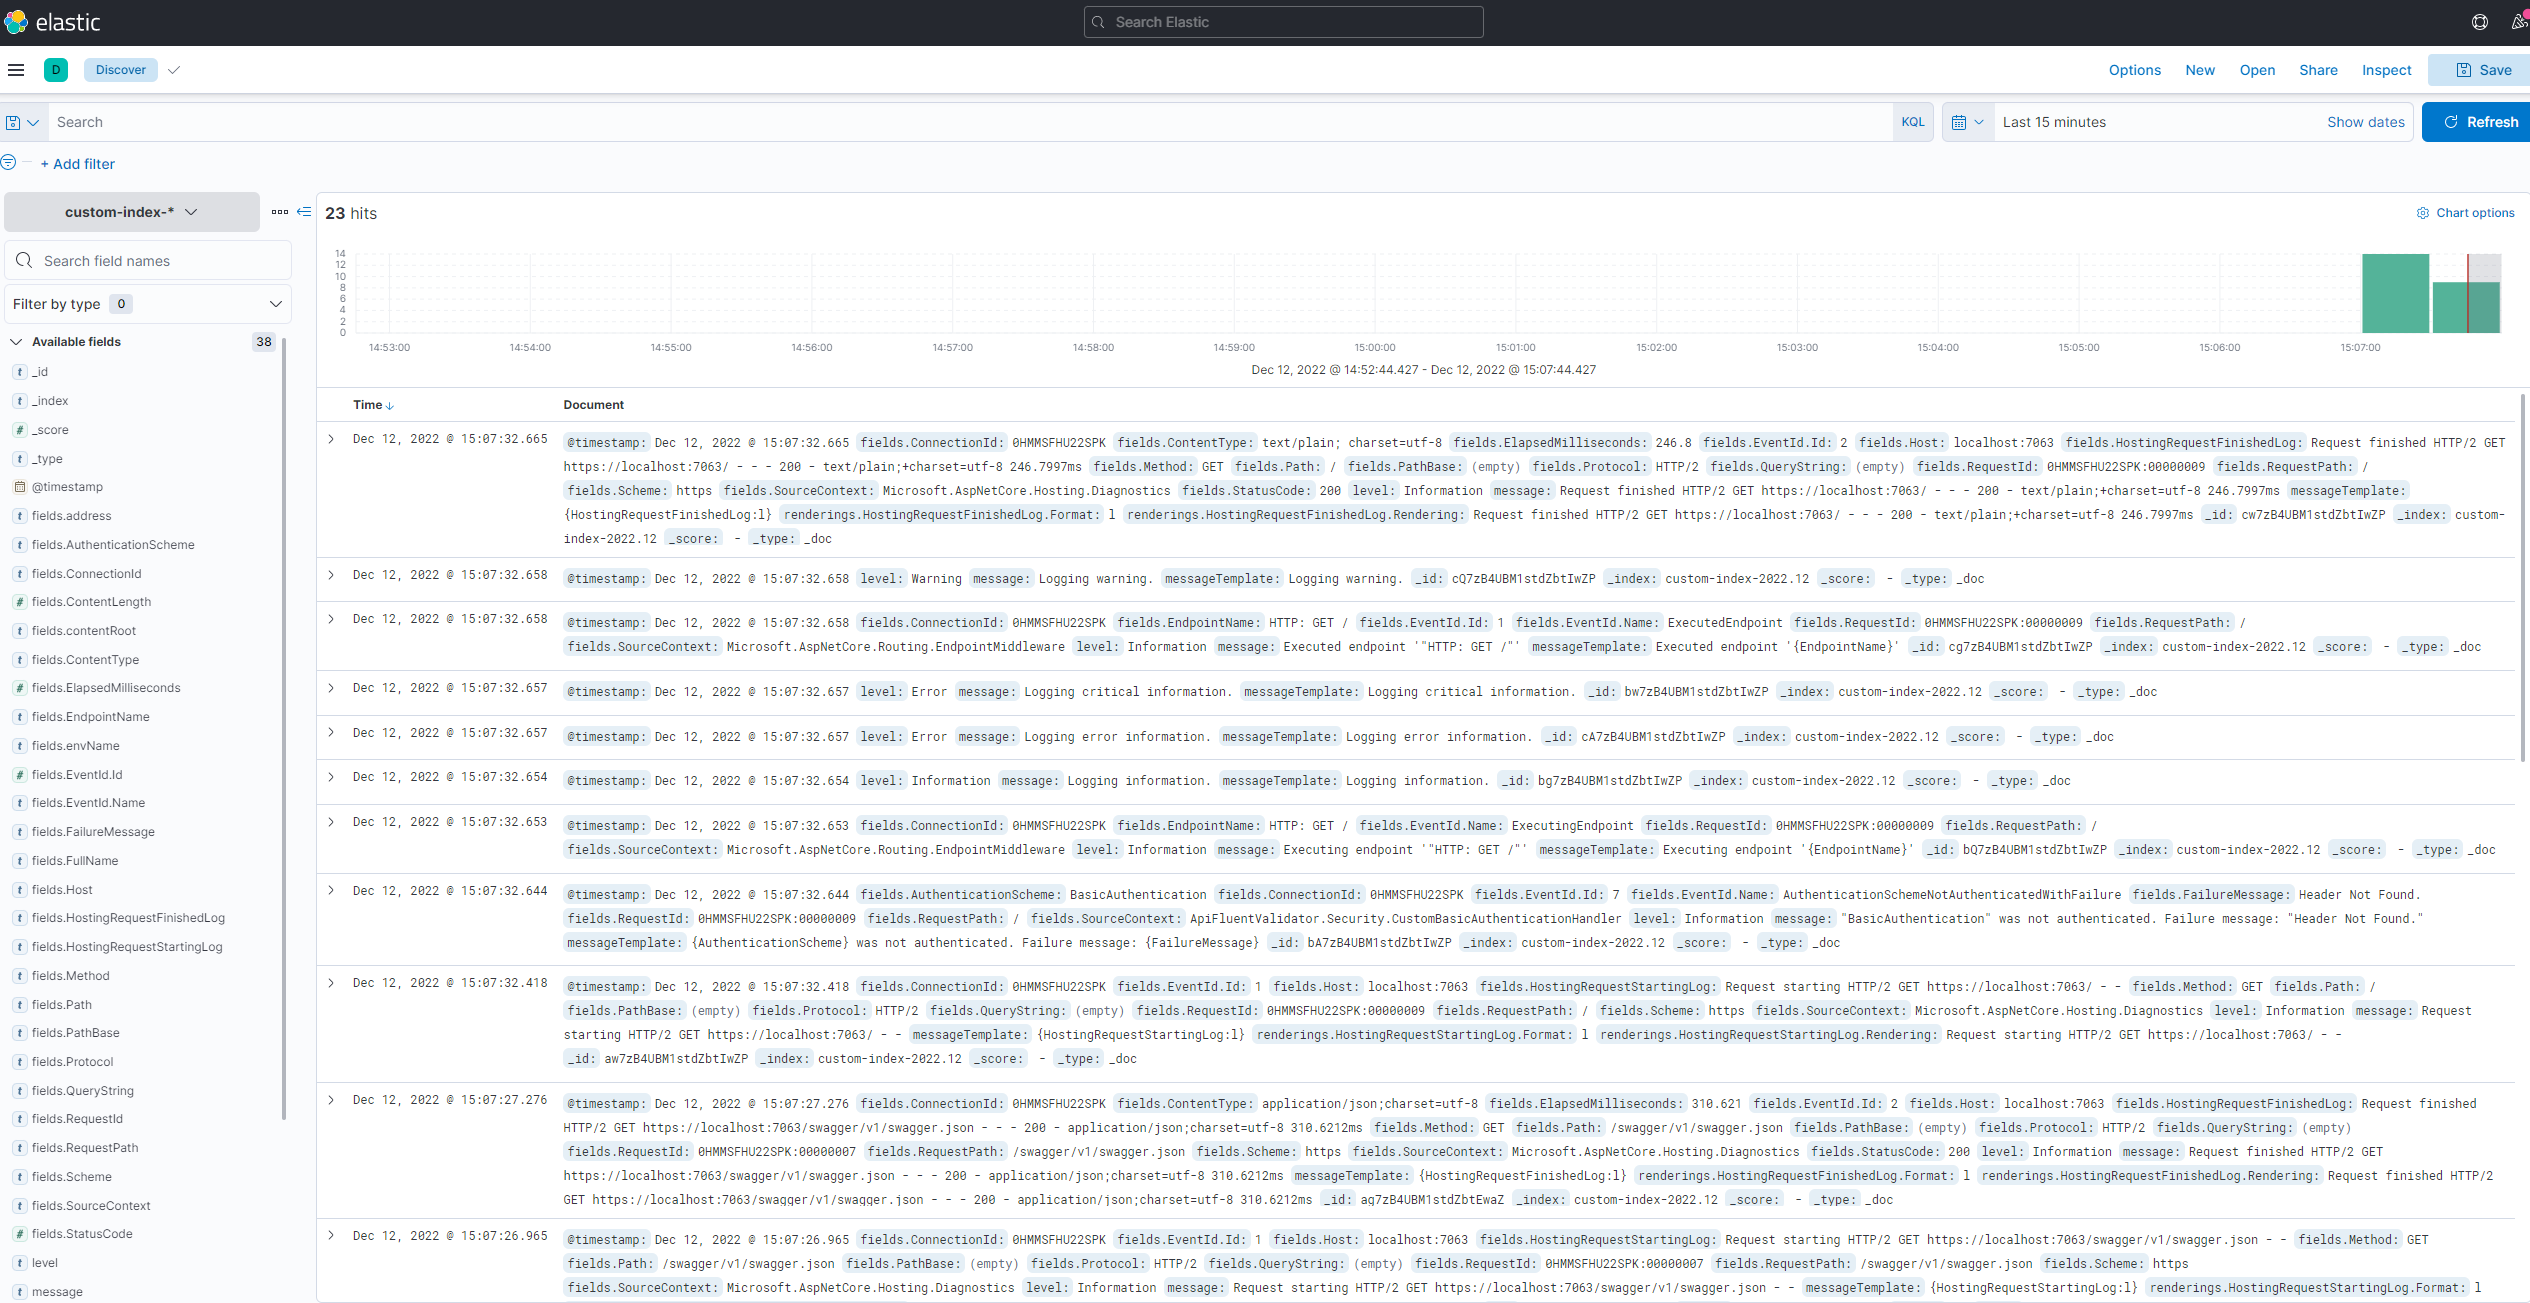
To view the logs generated by the app we need to access the Discover link again. We also can search for specific logs.
Wrapping Up
You can find the full code on my GitHub.